EnterprisePricing

%20Blog%20-%20Top%205%20KPI%20Dashboards%20Software%20for%20Service%20Businesses%20in%202026.png)
I have spent the last several years watching service businesses try to get a clear picture of how they are performing. Most of them are not short of data: they have timesheets, project trackers, invoicing tools, CRMs, and spreadsheets all running in parallel. The problem is that none of it talks to each other, so every Monday morning someone spends two hours pulling numbers into a deck that is already out of date by the time anyone reads it.
KPI dashboard software is supposed to fix that. And for a lot of businesses it does, once they find the right tool for how they actually work. The problem is that most dashboard tools were built for SaaS companies, e-commerce brands, or internal finance reporting, not service delivery.
Service businesses, consultancies, legal practices, accounting firms, and IT service providers have very different operational KPIs. Your most important numbers are not monthly recurring revenue and churn. They are utilization, project profitability, time to invoice, approval bottlenecks, and whether work is actually getting delivered on time.
I am obviously not a neutral voice here. Noloco is on this list. But I have used or evaluated every other tool on it, and I will tell you what I actually think, including where they beat us.
Before I get into the list, one stat worth sitting with: over 70% of SMBs fail to meet their growth targets because of lack of visibility into how the business is actually performing (Source: CrmLeaf, 2025)
The right dashboard does not just show you numbers. It helps your team spot delivery issues, margin problems, and bottlenecks before they become client problems.
Here is what I would actually consider in 2026 if I were running a growing service business today.
TL;DR
- Most KPI dashboard software are built for SaaS or finance teams first, not service teams
- The hardest part is usually not building the dashboard; it is getting clean operational data into one place.
- Looker Studio is a solid free reporting tool, but setting it up usually requires technical work, and it's not focused on service-business data.
- Databox is great for pulling metrics from multiple tools into one dashboard, but it's mostly read-only and not designed for client-facing use.
- Klipfolio is one of the most flexible tool on this list, but it takes time to configure and pricing can become expensive as usage grows.
- monday.com includes dashboards, but reporting is secondary to project management, and giving clients access can get expensive quickly.
- Noloco takes a different approach. Instead of just visualizing data, Noloco gives service businesses one place to run operations: dashboards, client portals, workflows, and permissions in one system.
I'm obviously biased because we built Noloco, but after working with 1,000+ service businesses, we kept seeing the same problem: teams didn't just need prettier dashboards, they needed a system to actually run the business.
What to look for before you pick a tool
Before I get into the list, a few questions worth asking yourself, because the wrong answer to any of these will rule out half the options immediately.
- Do your clients need to see the dashboard, or is it internal only? If clients need a view, you need a tool with proper external access and permissions. Most dashboard tools are not built for this.
- Where does your data actually live? If it is in a project management tool, a CRM, and a spreadsheet, you need something that can pull from all three. If it is in one system, your options are broader.
- Do you need to track project-level KPIs or firm-level KPIs? Project profitability by client is a different problem from overall utilization across the team. Some tools handle one well and the other poorly.
- How much setup time do you actually have? A flexible tool that takes three months to configure is not better than a simpler tool you can use this week.
How do the top 5 compare at a glance?
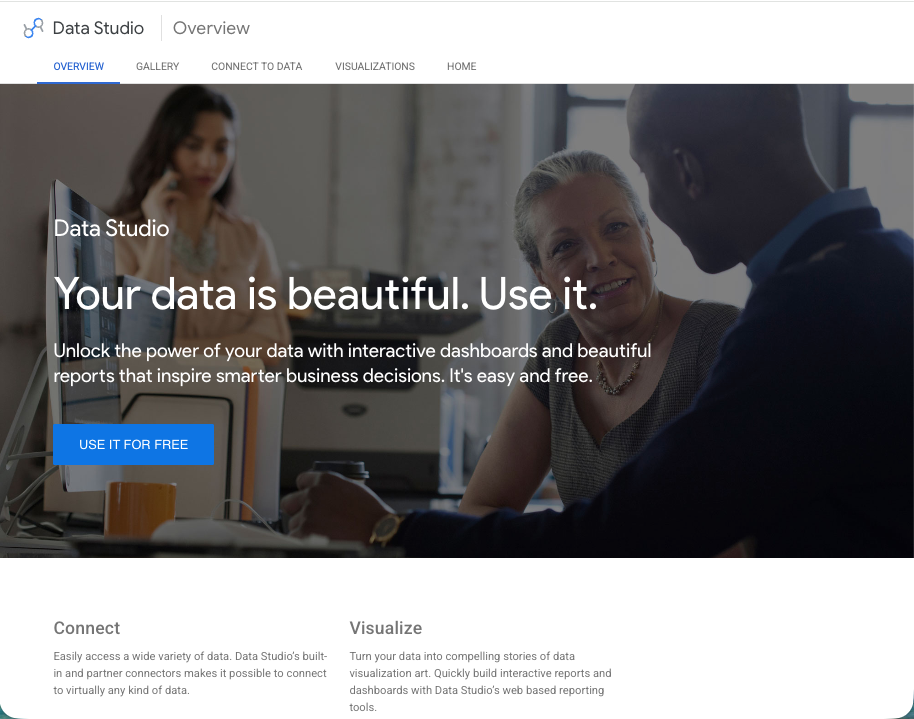
1. Looker Studio
Best for: firms that already have their data in Google Sheets, Google Analytics, or BigQuery and want a free reporting layer on top.
Looker Studio is free, which is genuinely hard to argue with. You connect a data source, drag in some charts, share a link. For a firm that already has its KPIs living in a well-structured Google Sheet, it is a reasonable starting point.
My honest take: the free price tag comes with a catch. Looker Studio does not have data of its own. It is a visualization layer, nothing more, which means someone still has to maintain the data underneath it. If your project data lives in three different places, you are going to spend more time keeping the data clean than actually looking at the dashboard. I have seen firms spend six weeks setting up a Looker Studio dashboard and then quietly stop updating the underlying spreadsheet because it was too much work. The dashboard becomes a monument to a data process that nobody maintains.
It is also not built for client-facing use. You can share a link, but there is no login, no permissions, no "Client A sees Client A's data and nothing else." If you need clients in the dashboard, Looker Studio is not the tool.
When it makes sense: your data is already clean and centralized, you have someone technical enough to set up the connectors, and you do not need clients to log in.
2. Databox
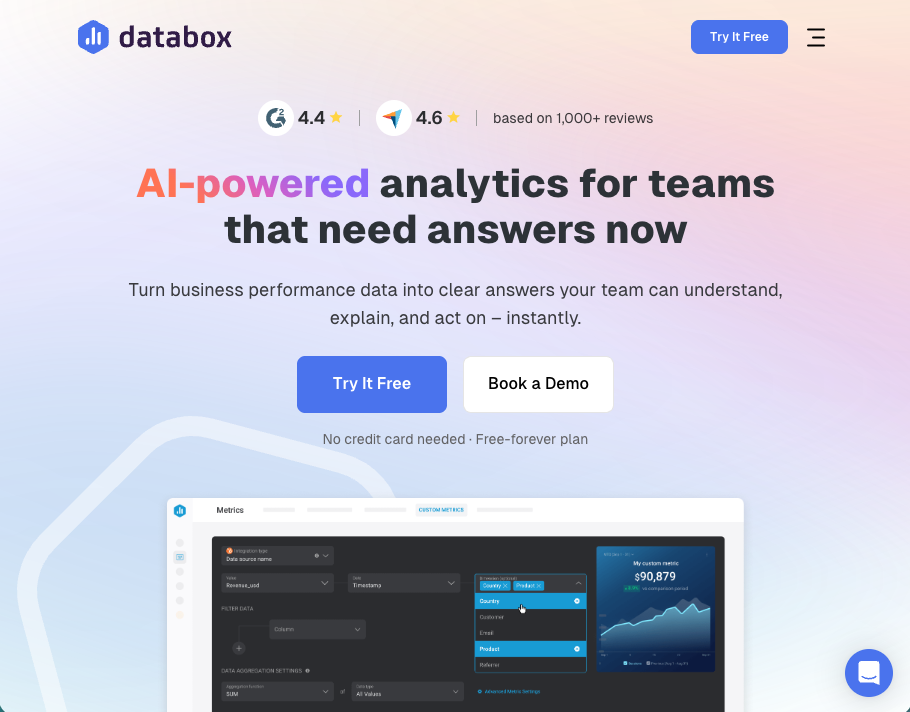
Best for: pulling together metrics from many different tools (HubSpot, Google Analytics, Xero, Stripe, etc.) into a single screen.
Databox is genuinely good at one thing: aggregating. If your KPIs are scattered across a CRM, an invoicing tool, and a project management platform, Databox can pull them all into one place without much configuration. The interface is clean, the mobile app is solid, and the pre-built integrations cover most of the tools a service business is likely to already be using.
Where it falls short for service firms is depth on delivery metrics. Databox is strong on top-line numbers, pipeline, revenue, customer counts. It is weaker on the operational detail that matters for a service business: how many hours did the team spend on a project versus what was scoped, what is the margin per client, which projects are at risk of going over budget. You can build some of this with custom metrics, but it takes effort and the result is still a read-only dashboard, not something you can act on inside the same system.
There is also no client portal. You can share a dashboard publicly or with a private link, but there is no concept of a client logging in to see their own numbers and only their numbers.
When it makes sense: you want one screen showing all your top-level firm KPIs pulled from tools you already use, and you are not trying to share those numbers with clients directly.
3. Klipfolio
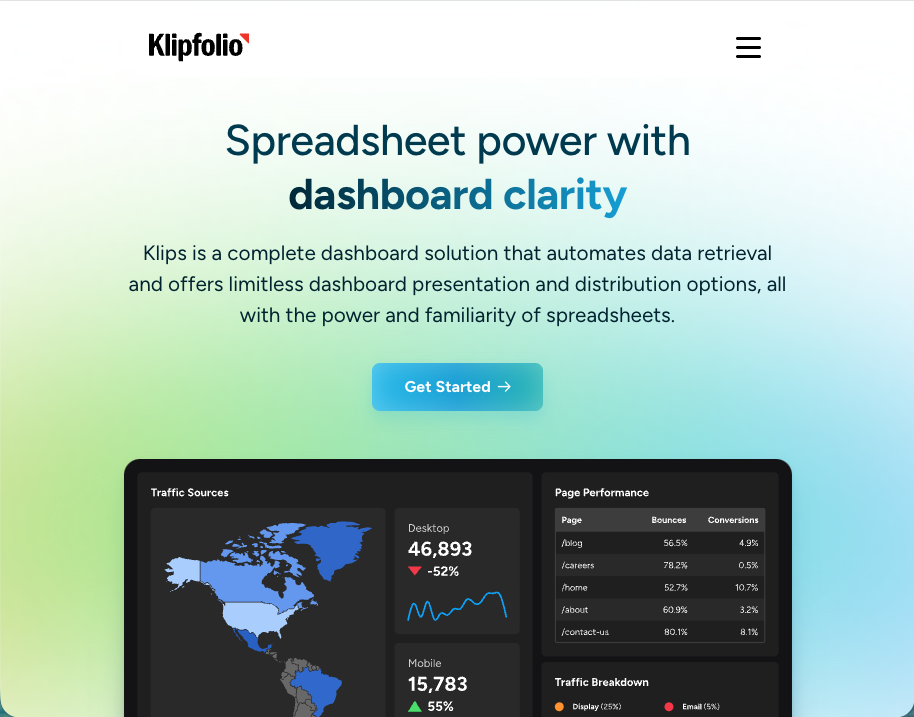
Best for: firms with specific, non-standard KPI requirements that need maximum flexibility in how they visualize data.
Klipfolio has been around for a long time and it shows in the depth of the product. The data connector library is extensive, the formula engine is powerful, and you can build dashboards that look exactly how you want them to look. If you have unusual KPIs that no off-the-shelf tool tracks natively, Klipfolio can probably handle them.
The tradeoff is setup time, as Klipfolio rewards investment. If you are willing to spend two or three weeks building out your data model and dashboard structure, the end result can be excellent. If you need something running this month, it is probably not the right tool. The learning curve is steeper than the alternatives, and pricing climbs quickly once you need multiple dashboards or users.
Like Databox, it is also not designed for external client access: the focus is internal reporting.
When it makes sense: you have genuinely complex or custom KPI requirements, someone on your team who can handle the configuration, and you are not trying to give clients direct portal access.
4. Monday.com
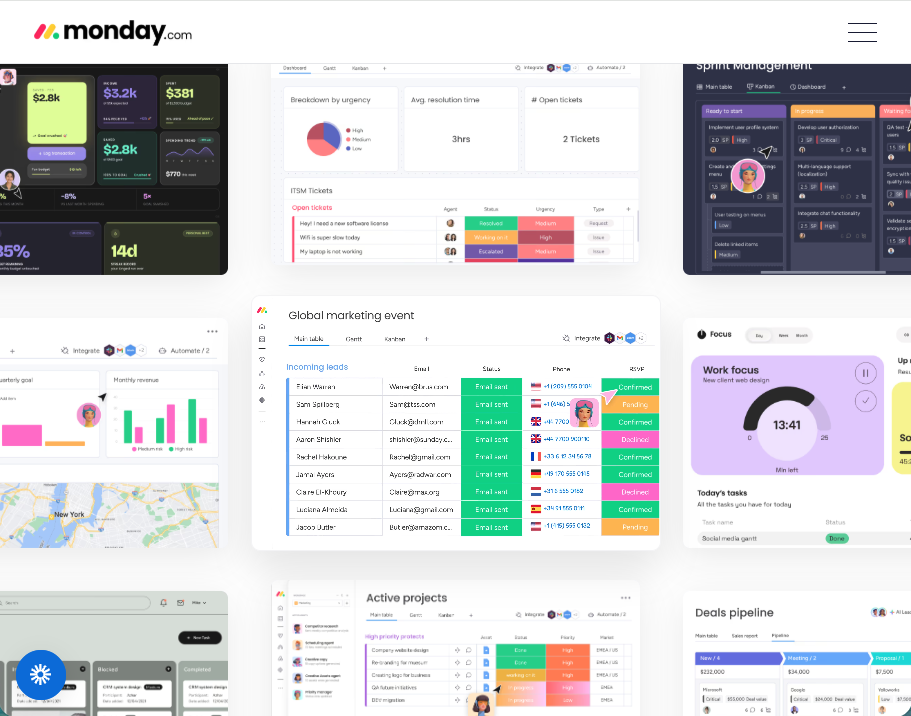
Best for: teams already running their projects in monday.com who want dashboards without switching tools.
If your firm is already on monday.com for project management, the dashboard feature is a reasonable add-on. You can surface task completion rates, workload by team member, and project status summaries without leaving the tool. For teams that are already bought in to the monday way of working, it reduces tool switching.
My concern with monday.com for service businesses is the same one I have had since we started Noloco: it is a project management tool first, and everything else is bolted on. The dashboards are not particularly deep. The client-facing access is not cheap: clients are charged per seat, which means the cost scales fast as your client list grows. And the workflows are rigid enough that firms with non-standard delivery processes tend to end up working around the tool rather than with it.
To be direct: if you are not already on monday.com, I would not start there just for the dashboards. The per-seat pricing model makes it an expensive choice for any firm that needs to give clients meaningful access.
When it makes sense: your team is already on monday.com, you need basic project dashboards rather than deep analytics, and client access is not a core requirement.
5. Noloco
Best for: service businesses that want KPI dashboards, client-facing reporting, and workflow management in one connected system.
I built Noloco, so I am going to be upfront: you should weight my opinion here accordingly. That said, I will tell you what I would tell you if I were not the founder.
The reason I built Noloco is precisely because none of the other tools on this list solve the full problem for a service business. They either give you a good dashboard with no client access, or they give you client access with no real depth on service-delivery KPIs, or they give you project management with dashboards tacked on.
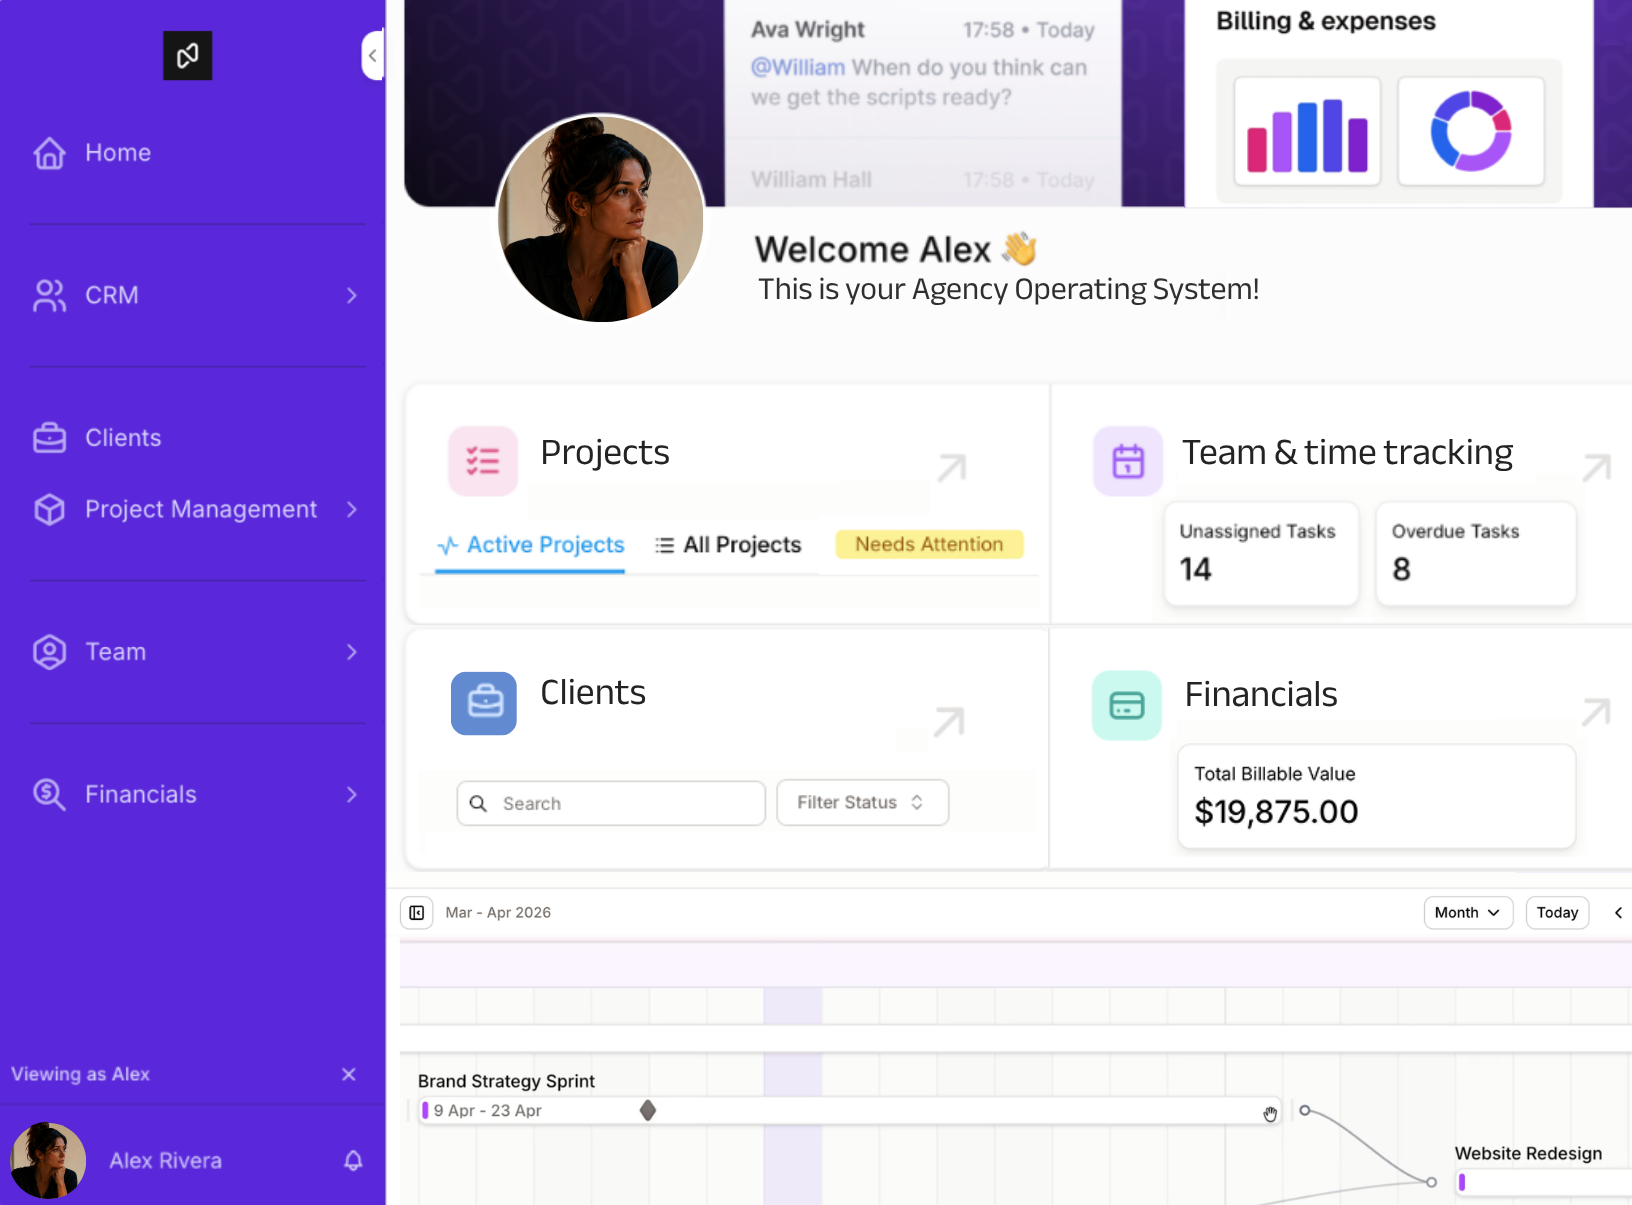
What Noloco does differently is treat the dashboard, the data, the client portal, and the permissions as one system rather than four separate products. You can track utilization by team member, project profitability by client, time from brief to delivery, outstanding approvals, anything your business needs to see. You can then surface a version of those numbers to each client through a branded portal where they only see their own data. And you can build the approval workflows and request management on top of the same data, so the operational side and the reporting side are connected.
The honest limitation: Noloco is not a best-in-class data vizualization tool in the way that Klipfolio is. If you need highly custom chart types or advanced statistical analysis, you will find the vizualization options more constrained. What you gain is everything being connected in one place and no per-seat charge for client access.
See how Noloco handles KPI tracking and client reporting for service firms
Final thoughts
The best KPI dashboard for your service business is not the one with the most features. It is the one your team will actually use, with data you trust, that shows you the numbers that drive decisions.
If I were starting fresh and had no existing tools: I would probably try Looker Studio for a month to understand what I actually need, then move to something more structured once I had a clearer picture of which KPIs matter most. If I needed clients to see their own numbers, I would skip Looker Studio entirely and go straight to something with a proper permission model.
The honest truth is that most service businesses underinvest in visibility. They know something is wrong, but they are working off last month's timesheet export and a gut feeling rather than a dashboard that updates when a project status changes. That gap costs real money, in projects that go over budget without anyone noticing, in clients who churn because they did not feel informed, in proposals that get priced on optimistic assumptions rather than actual delivery data.
Picking a tool and setting it up properly is one afternoon of work. The cost of not doing it compounds every month.
See how Noloco tracks service KPIs and client reporting in one place
FAQ
What is the best KPI dashboard software for a small service business?
It depends on what you need the dashboard to do. If you just need an internal view of firm-level metrics pulled from existing tools, Databox is a strong starting point. If you need clients to log in and see their own project numbers, you need a tool with a proper client portal and permission model, which rules out most pure dashboard tools. Noloco is the option I would recommend for the second use case.
What KPIs should a professional services firm track?
The most useful KPIs are the ones that help you spot delivery issues early and understand whether work is actually profitable. For most service businesses, that includes: team utilization (billable hours as a percentage of total hours), project margin (revenue minus actual delivery cost), on-time delivery rate, time to invoice, and scope change frequency (how often work goes outside the original scope). Most firms track too many metrics without using them to make decisions. A small set of KPIs reviewed weekly is usually far more useful than a 30-metric dashboard nobody checks.
Can I share a KPI dashboard directly with clients?
Most dashboard tools are built for internal use and do not have a proper client-facing access model. Looker Studio lets you share a public link, but there is no login and no way to show Client A only Client A's data. Databox and Klipfolio have limited external sharing. monday.com charges per external seat. If client-facing reporting is a core requirement, you need a tool designed for it from the start, like Noloco.
Is monday.com good for KPI tracking in a service business?
It is adequate if you are already running projects in monday.com and need basic visibility into project status and team workload. It is not a strong choice if you need deep financial KPIs, project profitability tracking, or client-facing dashboards without paying per external seat. The dashboards are a secondary feature in a project management tool, not a primary one.
How do I know when my service business has outgrown spreadsheets for KPI tracking?
When someone has to spend more than an hour a week pulling numbers together before a management meeting, you have outgrown spreadsheets. When you cannot answer "what is our utilization this month?" without opening three different files, you have outgrown spreadsheets. When a director and an account manager give different answers to the same question because they are looking at different versions of the same data, you have definitely outgrown spreadsheets.
Does Noloco integrate with Airtable for KPI tracking?
Yes. If your project and delivery data already lives in Airtable, Noloco connects directly to your Airtable bases as the data source and builds the dashboard and client-facing views on top. Your team keeps working in Airtable. The KPI views and client portal sit in Noloco. See how the Airtable integration works.
Related resources
- Secure client portal permissions for service businesses How to design the access and permission structure that sits underneath your client-facing dashboards.
- Client portal approval workflows in 2026 How to connect your KPI tracking to a structured approval and request management process.
- Noloco client portal solution How Noloco builds client-facing dashboards and portals for professional services firms.
- Noloco and Airtable How to add a proper dashboard and client portal layer on top of your existing Airtable data.
- Agency operating system How service firms use Noloco to connect delivery, client reporting, and operations in one place.
Author


Our recent posts
Explore all blog posts

Your most common
questions—answered!
Who is Noloco best suited to?
+
-
Noloco is perfect for small to medium-sized service businesses like consultancies, agencies, advisory firms, as well as engineering and industrial services such as energy, construction, or any other operations-focused fields.
Do I need tech experience to use the platform?
+
-
Not at all! Noloco is designed especially for non-tech teams. Simply build your custom system using a drag-and-drop interface. No developers needed!
Is my data secure?
+
-
Absolutely! Security is very important to us. Our access control features let you limit who can see certain data, so only the right people can access sensitive information
Do you offer customer support?
+
-
Yes! We provide customer support through various channels—like chat, email, and help articles—to assist you in any way we can.
My business is growing fast—can Noloco keep up?
+
-
Definitely! Noloco makes it easy to tweak your system as your business grows, adapting to your changing workflows and needs.
Is there any training or support available to help my team get up to speed?
+
-
Yes! We offer tutorials, guides, and AI assistance to help you and your team learn how to use Noloco quickly.
Can I make changes to my app after it’s been created?
+
-
Of course! You can adjust your app whenever needed. Add new features, redesign the layout, or make any other changes you need—you’re in full control.
Ready to boost
your business?
Build your custom tool with Noloco