EnterprisePricing
What is an Agency Profitability Dashboard?
A visual reporting tool that gives agency leaders a real-time view of financial performance across clients, projects, and teams.
Running a profitable agency requires more than intuition. Leaders need current, accurate data on margins, utilisation, and costs — not figures that arrive weeks late in a spreadsheet. An agency profitability dashboard puts that financial intelligence front and centre, enabling faster and better decisions.
Agency Profitability Dashboard: Meaning
An agency profitability dashboard is a real-time visual interface that aggregates financial and operational data across an agency's clients, projects, and teams to provide a clear picture of business performance. It typically shows revenue, costs, margins, utilisation rates, and variances against targets — updated automatically from connected data sources.
Unlike static monthly reports, a live profitability dashboard allows leaders to spot problems and opportunities as they develop, not after the fact.
Key Metrics on an Agency Profitability Dashboard
- Gross margin by project and client: Revenue minus direct delivery costs, expressed as a percentage.
- Team utilisation rate: The proportion of team time that is billable versus overhead.
- Revenue per head: Total revenue divided by headcount — a key agency efficiency metric.
- Budget vs. actuals: Planned project costs against time and expenses actually consumed.
- Retainer health: Hours delivered vs. retainer allocation across all ongoing clients.
- Outstanding invoices: Billed but unpaid amounts affecting cash flow.
- Pipeline value: Upcoming revenue from confirmed or probable projects.
Why Every Agency Needs a Profitability Dashboard
Agency profitability is often invisible until it's too late. Projects run over, utilisation drops, scope creep erodes margins — and without a live dashboard, leaders only discover the damage when the month-end figures land. A profitability dashboard enables:
- Early intervention when a project is trending over budget
- Identification of low-margin clients or project types
- Data-driven decisions on pricing, resourcing, and capacity
- Confident conversations with clients about scope and billing
How Noloco Builds Agency Profitability Dashboards
Noloco's Charts and dashboards feature lets agencies build fully custom profitability dashboards connected to live project, time tracking, and billing data stored in Noloco Tables or synced from external tools via Noloco's integrations.
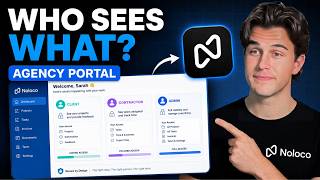
Different views for different roles: delivery managers see project-level margins, account directors see client health, and the CEO sees the full agency picture — all within the same Agency Operating System.

Ready to boost
your business?
Build your custom tool with Noloco